Response-time and call-volume report from public emergency-call data
- The situation
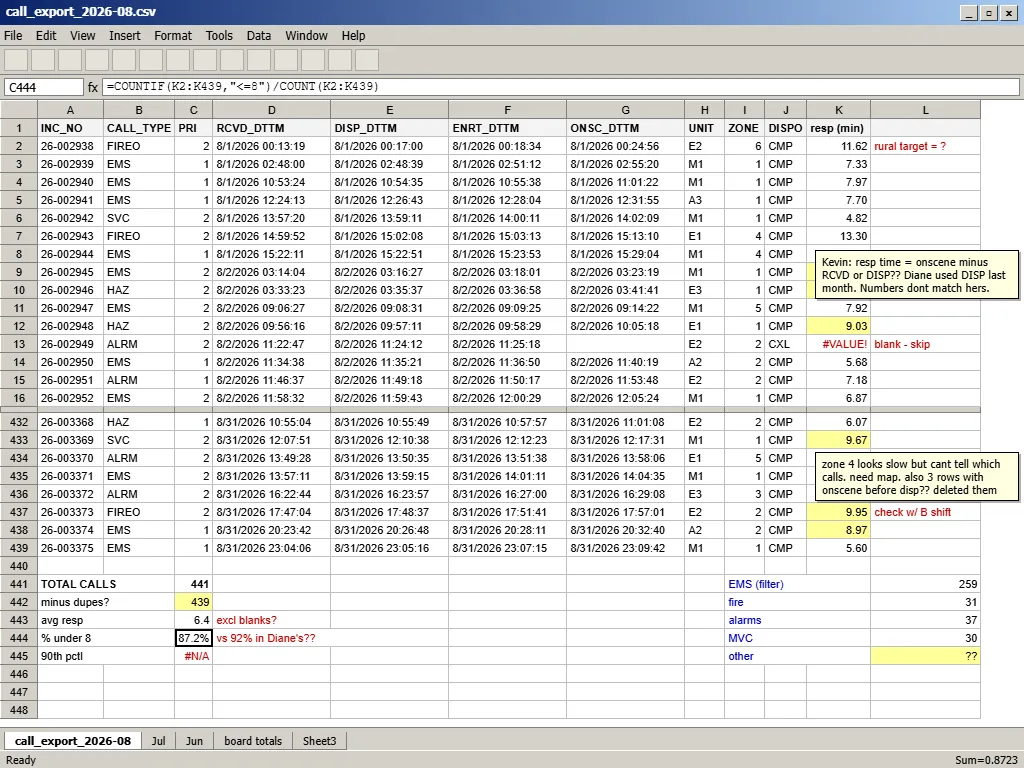
A fire and EMS district with four stations reports call volume and response times to its board every month. Staff copied the dispatch export into a spreadsheet and typed the totals by hand. Two people could get two different answers, and nobody could see where or when responses ran late.
- What was built
A report that reads the dispatch export and applies the same checks every time. It shows calls by type, response times against each zone's target, the 90th percentile by zone, and turnout and travel times by station. It also has a 24-hour clock of call volume and a district map of late calls. Records it cannot use are counted, with the reason. One button lays the month out for the board on Letter paper.
- The result
4,960 calls over 12 months checked against one set of rules, showing Zone 4 reached 67.9% of its priority calls within target against a 90% goal.
- What the client received
The working report, a page explaining how each figure is calculated, 12 months of call data and a two-page print layout for the board.
Try it Pick a month on the chart and find where calls ran late.
Describe your project and we will send you a fixed-price quote.