Monthly board report generated from a public dataset
- The situation
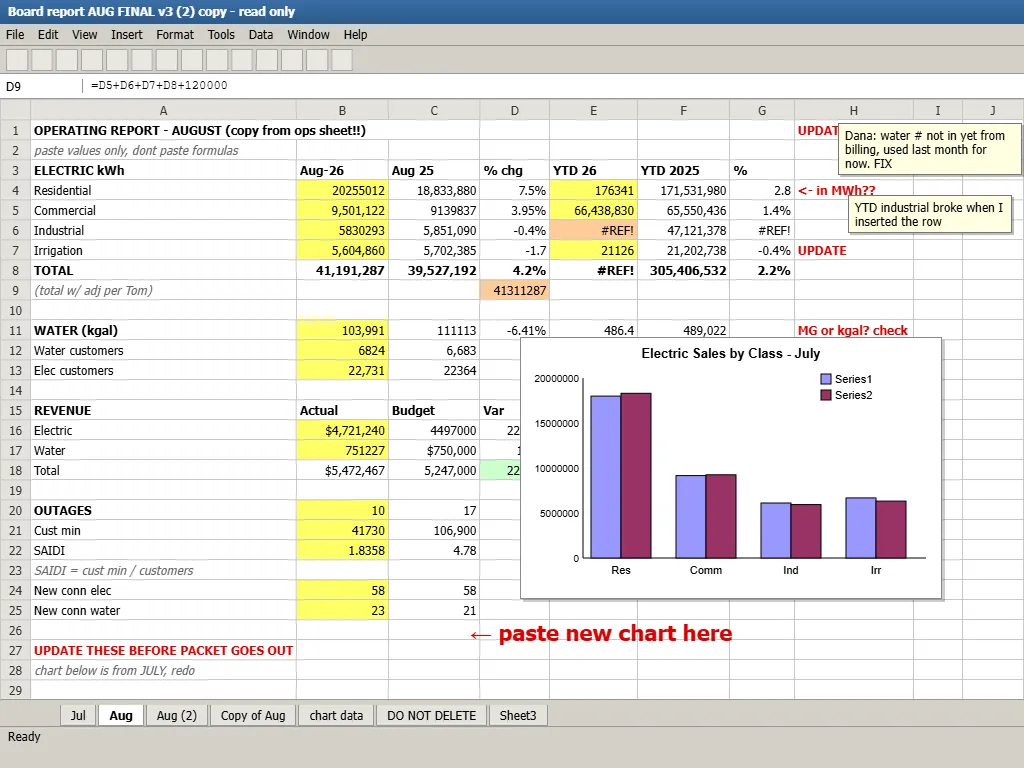
A small public utility district publishes its monthly operating data, and the board gets a report built from it each month. The analyst copied the figures by hand, made the charts and pasted them in. Mistakes got through and the packet ran late.
- What was built
A scheduled run reads the published dataset at 6:00 a.m. on the third business day of each month. It runs ten checks before it releases anything. The report writes its own summary sentences from the numbers and carries tables and charts for the month, the year to date and the same month last year. Any figure can be selected to show the exact rows and column it came from.
- The result
A 148-figure board report built in under two minutes, every figure traced to its row.
- What the client received
The report page, the run sheet with its log and checks, and the operating dataset as a CSV file.
Try it Click any number to see where it came from.
Describe your project and we will send you a fixed-price quote.